Put Your Data to Work With the New Open Reports Engine
If you’ve ever needed to run a report from your LMS or dig into your learner analytics, you’ll know that some learning platforms don’t offer much in the way of reporting capabilities. At Open LMS, we’ve been helping LMS administrators harness their reporting for years and now there’s even more: enhanced reporting capabilities.
Whether you’re a corporate LMS or higher education learning management system user, Open Report Engine (ORE) gives you more control over the types of reports you generate—without relying on additional support from a programmer or developer! With ORE, clients save time and are empowered to create, edit, and export reports whenever and however you see fit.
GET MORE DATA INSIGHTS | ‘How to Empower Your Educational Decisions With Learning Analytics’
Embedded Data Visualizations and Plain Reports


ORE gives organizations and institutions the power to harness learner information to make data-backed decisions about everything from course enrollments to compliance tracking initiatives. Six data visualizations are available:
- Column
- Line
- Smoothed line
- Horizontal bar
- Pie chart
- Doughnut
Reports with data visualizations can be embedded directly into a user’s dashboard to provide a quick view of essential information. For example, a report can be displayed on the dashboard as a doughnut chart (as seen above) to quickly show administrators how many users enroll in various courses. A report like this would help higher learning institutions quickly identify the most popular courses among students. The dashboard can include multiple reports with data visualization so administrators can track specific data in easy-to-digest ways.
While reports can be kept private, administrators can also choose to make these data visualizations viewable to specific audiences based on the roles and permissions associated with a user. With ORE, administrators can create reports designated for instructors, and teachers can build reports they want their learners to see. Reports permissions can even be based on cohorts or assigned to a single user.
It’s important to note that all LMS users are considered authenticated users until they’re assigned to a course. Users aren’t automatically labeled as instructors or students before course enrollment, so those building reports should be mindful when establishing permissions for who can see the data.

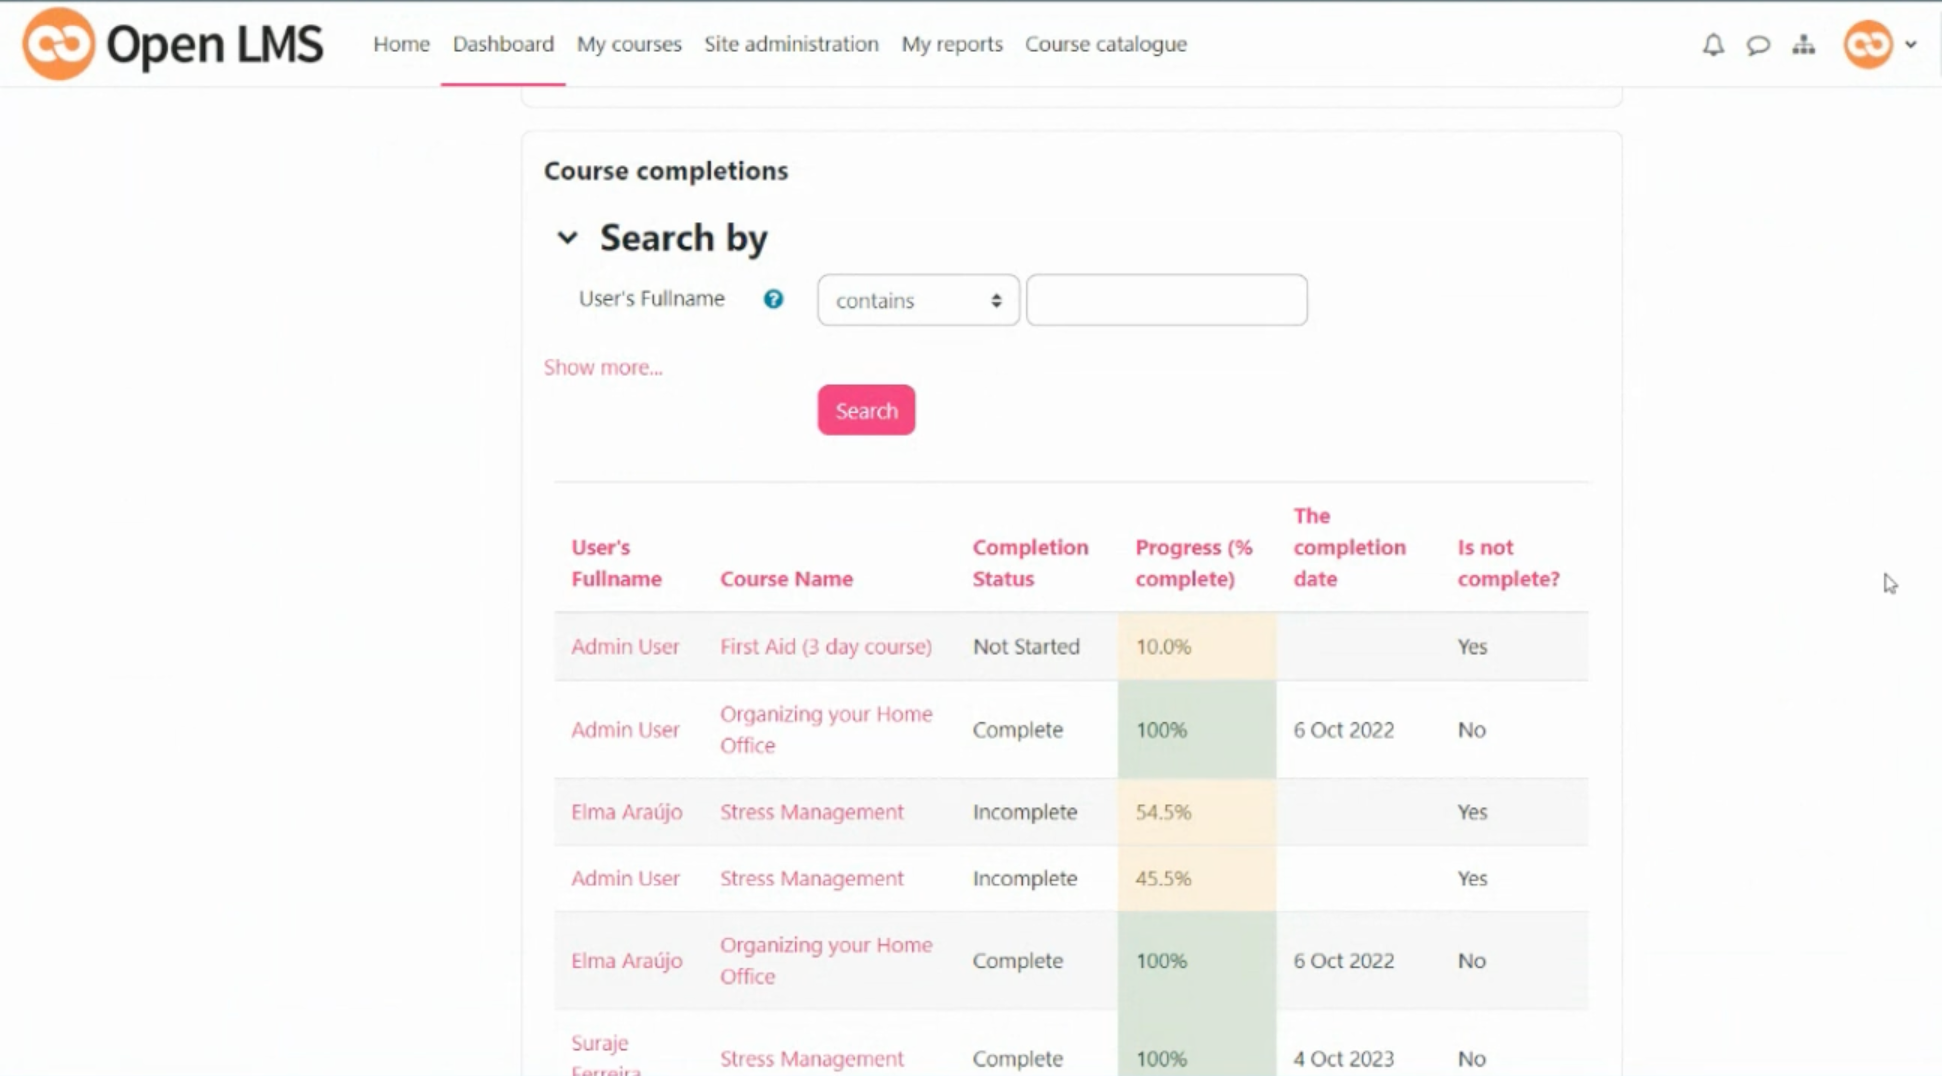
Plain reports can also be embedded in the dashboard. These reports can be built out to show highly detailed information based on the organization’s or institution’s needs. For example, a course completion report (shown above) indicates which users are enrolled in certain courses and whether or not they’ve finished the course. The report can be configured to include more detailed columns such as how much progress each user has made in the course, displayed as a percentage. Information like this is especially useful for instructors to determine which learners might need intervention or assistance to complete the course.
For instance, many higher learning organizations run their courses for 16-week semesters. If an instructor runs a report during the eighth week that shows some learners have only finished 10% of the course, then the instructor has a clear idea of who needs additional support or guidance for the remainder of the term.
READ MORE FROM THE BLOG | ‘Are You Maximizing eLearning Technology's Potential? A Q&A With Open LMS Project Manager, Jorge Vela’
Granular Reporting and Configurability

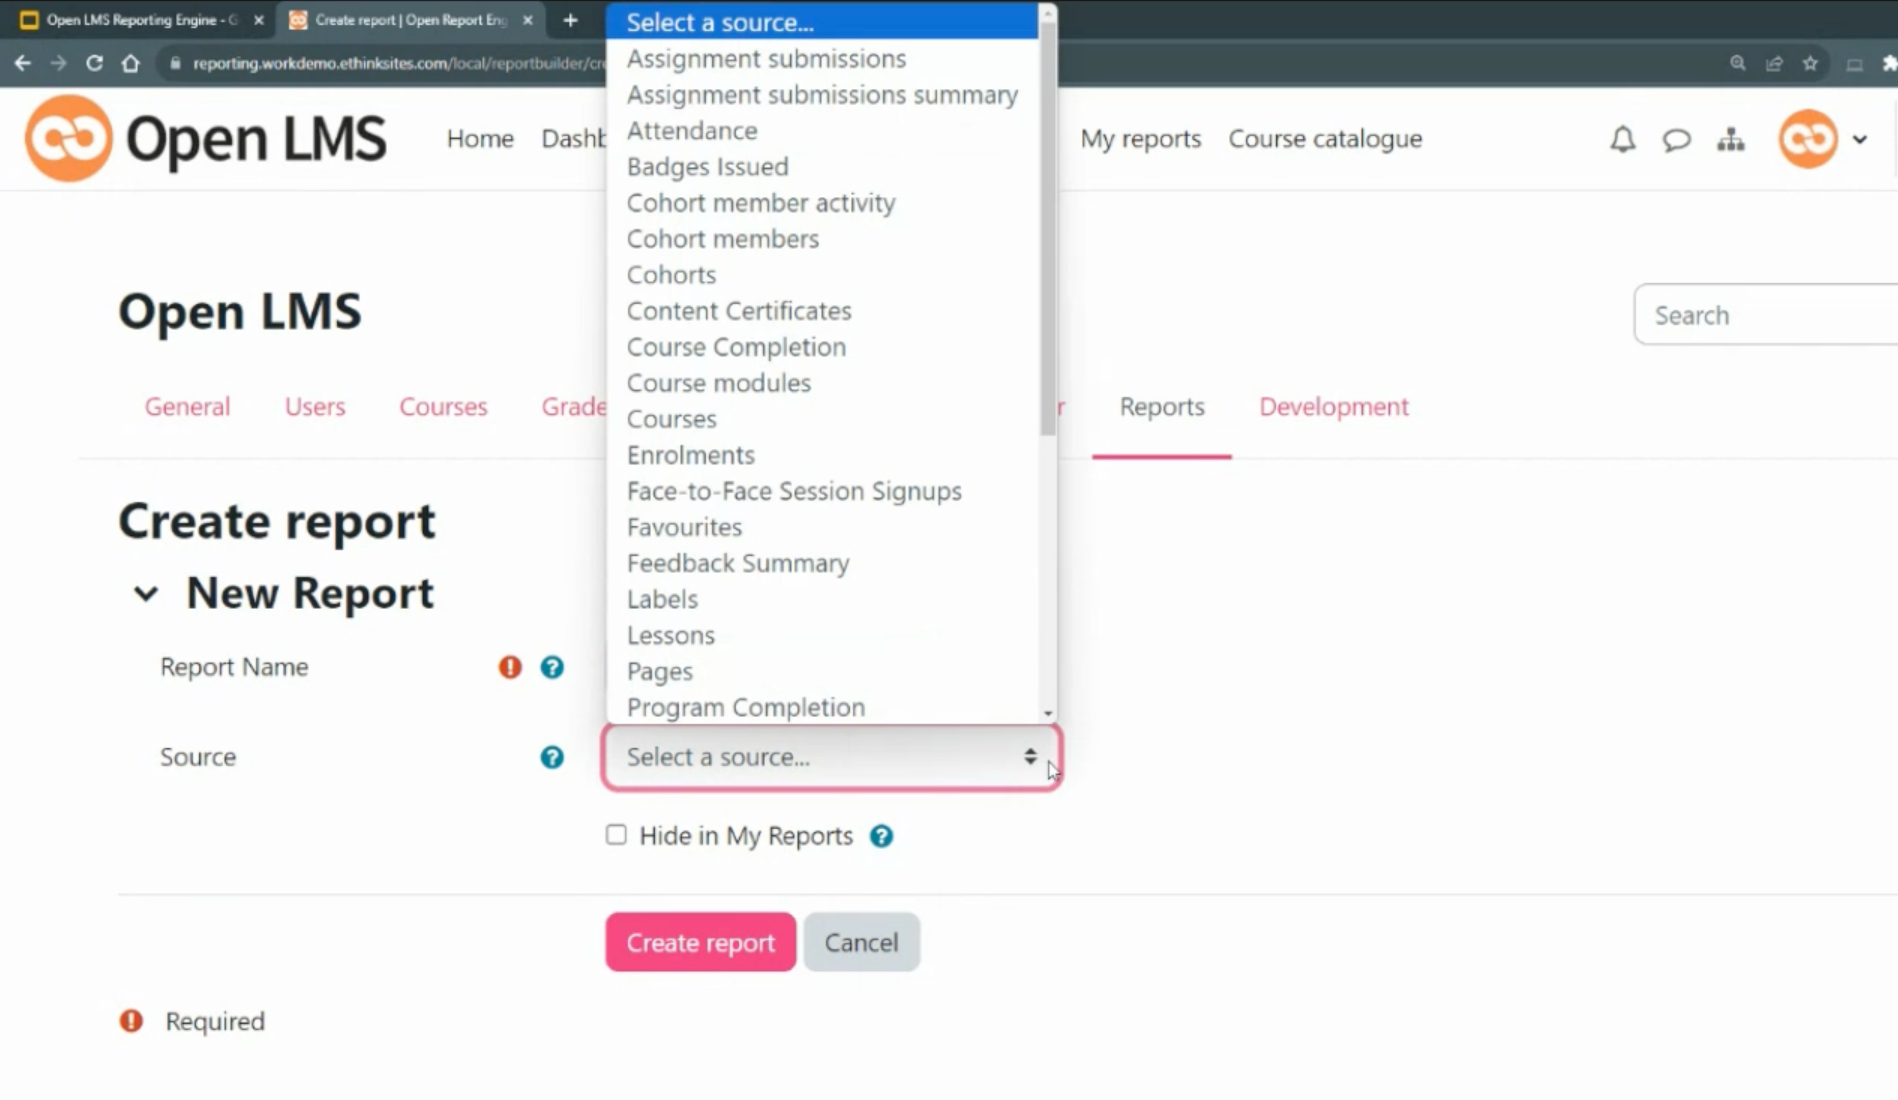
Running reports with ORE means digging into the nitty gritty of your data. ORE lets you create reports using more than 20 different sources (depending on which LMS plugins you’re already using). The granular level of detail makes it easy for your organization or higher education institution to determine exactly what it needs to know to inform future decisions. Source options include course completion, enrollments, cohorts, badges, SCORM, and many more.
You can even run a report to see how many reports you’ve already run. Organizations and institutions can use these reports to demonstrate how data and analytics help drive learner success or institutional achievement. This report can also be a useful compliance tool for organizations and institutions. With this report, you can demonstrate to regulatory agencies all the measures taken to ensure you’re staying within the required compliance guidelines. This kind of report can show:
- All of the data that’s gathered from the LMS
- The context for the information being gathered
- A description of the data being collected
- How frequently the reports are run
Build Reports as Unique as Your Needs With Open LMS


ORE makes it easy to discover the specific data you need to achieve your goals. The report builder lets you choose from seven broad categories to add columns to your reports. Within each of the broader categories, you can drill down further to extract more specific information.
For example, you might be an instructional designer for a company with a multilingual staff. You can include a column called “Course Language” in your report that shows which languages employees use to complete a training course. With that data, you can discern which languages are the most popular for your users and offer more professional development courses in those preferred languages in the future. Doing so makes the training material more accessible for your workforce and demonstrates your commitment to employees’ continuous development.
The report builder also lets you add a column called “Time to Complete.” With this data, you can see the time that’s elapsed between enrollment and course completion. If your organization or institution offers self-paced learning or training content, then this data is especially useful. You can see how long these courses take your users to complete and use the data to refine courses that aren’t helping you reach organizational or institutional goals.
Whether you’re working to improve learning outcomes at your institution or enhance employee training initiatives, ORE can get you the details you need to make informed decisions. This reporting feature is available for all Open LMS clients on version 4.1 or later.
HANDPICKED FOR YOU | ‘Open LMS 4.1 Is Here: Discover a Wealth of New Improvements’